As an example, I have taken screenshots from a host with 64 GB of physical RAM with 29 VMs running on it. In the first screenshot, we go to the VMware Infrastructure Client (VI Client), select the host and watch the summary tab. In the right-hand corner, we see the “Resources” section. The image below shows that memory usage is at 41.06 GB out of 64 GB.
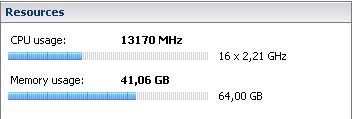
From this image, we can see that 41.06 GB of memory is in use out of an available 64. But wouldn’t you also like to know which processes or VMs are using the 41.06 GB? To find out, we’ll use PuTTY as our SSH client to run VMware’s esxtop tool.
Let’s start a PuTTY session. Log on, start esxtop and press M for memory. The top of the screen features an impressive amount of info on your host’s memory usage.
Let’s take it from the top.
Physical memory
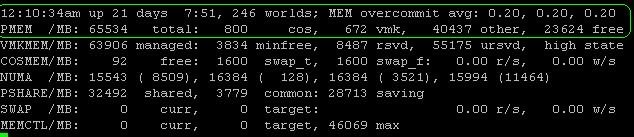
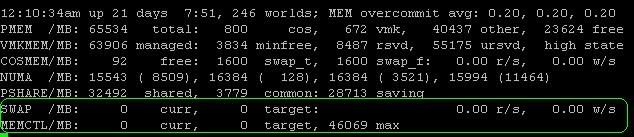
The MEM overcommit avg tells us that the average memory overcommitment over the past one is between five and 15 minutes. A value of 0.20 is a 20% overcommitment of memory. In the second line, we see the PMEM stats that describe physical memory in the host. This host has 65,534 MB (or 63.99 GB), of which 800 MB is allocated to the cos (i.e., the service console); 672 MB is being used by the VMkernel and 4,0437 MB (or 39.489 GB) is used by “other,” which leaves 23,624 MB of free memory.
Note: The memory used by “other” is officially described as: “everything other than the ESX Service Console and ESX VMkernel.” It is not necessarily all memory consumed by the VM. Each VM, for example, also has memory overhead. The amount of overhead memory depends on the type of guest OS,the number of virtual CPUs, configured amount of guest memory and on whether the guest is 32-bit or 64-bit. For example, a dual-CPU virtual machine with 2,048 MB memory will have 126 MB overhead as 32-bit system and 163 MB overhead as a 64-bit system.
Service console memory
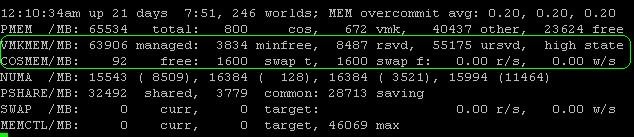
The next line about VMKMEM is of less importance, though it does tell you how the VMkernel performs. But unless you’re troubleshooting an unusual problem, you won’t work with these values. Of more value is how the service console (cos) is doing, which is detailed on the next line. The first value (in this case, free) is the amount of idle memory in your cos. In our example, the cos has 92 MB RAM free out of the 800 MB allocated. Next, we see the swap space configured and swap space free, which are both 1,600 MB. Usually, I configure a host with a 1,600 MB swap partition and 800 MB cos memory.
While 800 MB may seem like a lot, third-party agents often run in the console and so the default 272 MB of memory is not enough. In that event, you want to increase cos memory and set it to 800 MB. You could set it for a higher number, but you might run out of partition space. I therefore always set the swap partition to 1,600 MB since you can also assign only a maximum of 1,600 MB to the cos. Since implementing that as a best practice, I haven’t had to resize a swap partition once.
Transparent Page Sharing (TPS)
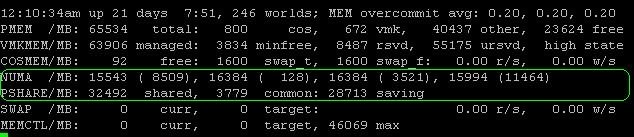
Back to our example, the Non-Uniform Memory Access, or NUMA, values in MB. As with VMkernel you seldom have to worry about these. It only shows you how ESX is distributing the memory across the NUMA nodes (if you have NUMA, that is) but these are not values you will be working with. Pay more attention to the PSHARE line. This one tells us how much memory is saved by transparent page sharing (TPS), which in some environments can be quite a lot. In our example, 32,492MB is shared between the VMs, of which 3,779 MB is common, which leaves us with savings of 28,713 MB (or 28 GB) of memory.
Let me explain this in a different way. On this host machine, a total of 32,492 MB is somehow the same in a lot of guests. By using transparent page sharing, ESX only needs 3,779 MB to “store” 32,492 MB. So we are saving 28,713 MB of memory. In my opinion, that is a large amount of memory to save on a single host. Just imagine how much this could save you across an entire virtual environment.
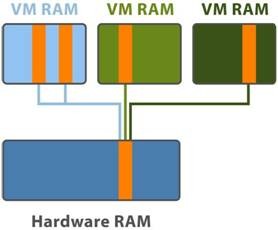
What is transparent page sharing?
VMware ESX can save lot of physical memory using transparent page sharing, especially in environments where a lot of similar OSes are in use. The hypervisor checks each block of memory that a virtual machine wants to write to physical memory. If that block of memory is equal to a block of memory already saved in physical memory, there is no need to use extra physical memory. Instead, ESX only sets a pointer and remembers that this block is used by other VMs. As longs as the VMs only read this block and never change it, the block is saved just once. ESX will use this block until a VM wants to make changes to the VM (write to the block). When that happens, ESX will create an additional copy.
When looking at Windows Server 2003, for example, one can see that a basic Windows install without any extra applications will easily occupy 250 MB RAM after startup. Now suppose I run 20 Windows VMs on one hypervisor. 20 instances of Windows requiring 250 MB RAM each would cost a total of 5,000 MB physical RAM without TPS. With TPS, however, 250 MB would have been stored and used only once. In other words, a memory savings of 5,750 MB. That’s not something to take lightly.
Swap memory and ballooning
This may sound strange, but I believe both SWAMp and MEMCTL numbers should be 0. Let me explain what they are:
* The SWAP value displays the ESX server swap usages statistics, where “cur” is the current swap usage, “target” is how much ESX expects to swap and “r/s” and “w/s” show the rate at which the swapping occurrs.
* MEMCTL shows the total amount (cur) of physical memory reclaimed using the vmmemctl module or the balloondriver, the total amount ESX attempts to reclaim (target) and the maximum amount ESX can reclaim (max).
Now, why should they be zero? Simply put, because they are both indications that ESX doesn’t have enough memory to give to the guests. The first thing ESX wants to do when resources are getting scarce is reclaim the least valuable memory from the guest OS. Because ESX can not talk directly to the OS, it uses the VMware Tools memctl-driver for this.
Ballooning
When VMware ESX runs out of guest VM space, ESX starts a process inside the guest which claims memory. The guest OS will then check the list to see if it has memory that is not in use. If there is, it will will give this to the process. Next, VMware Tools will claim this memory and tell ESX exactly which memory blocks ESX can reuse for other VMs. In this way, the last pieces of unused memory are squeezed out of the other guests to give it to the guests that need it more.
Swap to disk
If the ballooning technique isn’t sufficient, ESX will use its last resort: swapping out guest memory to disk. As disks are always much slower than physical memory, the guest VM will notice a performance degradation so that is not the way we want to go.
Therefore, as soon as you see the SWAP curr or MEMCTRL curr rise above zero, you should really start investigating what is wrong. As a rule of thumb, you should never load your ESX memory to more than 80% or 85%. This way you always have spare memory in case VMs start to use more physcial memory. Also, loading your ESX hosts in a cluster at more than 80% to 85% can get you into trouble with your VMware High Availability failover level.
1 comment:
Thanks for your informative post!
I've been looking into a memory allocation problem recently; esxtop is showing about 30GB free (in a 64GB machine) but there's also about 9GB swap used and 8GB swap used. Why would ESX use swap when there's memory free? Could it be due to resource pools not being set correctly?
Here's the esxtop header. (sorry I can't use a pre tag, it's not accepted by blogger)
12:04:25pm up 5 days 22:18, 224 worlds; MEM overcommit avg: 0.71, 0.71, 0.71
PMEM /MB: 65533 total: 800 cos, 594 vmk, 34068 other, 30070 free
VMKMEM/MB: 63973 managed: 3838 minfree, 8400 rsvd, 55337 ursvd, high state
COSMEM/MB: 191 free: 541 swap_t, 541 swap_f: 0.00 r/s, 0.00 w/s
PSHARE/MB: 25603 shared, 1085 common: 24518 saving
SWAP /MB: 8795 curr, 2715 target: 0.01 r/s, 0.00 w/s
MEMCTL/MB: 7825 curr, 7825 target, 52575 max
Thanks for any suggestions!
Dave
Post a Comment